Welcome to the Azure Cost Optimization Dashboard!
or… How we saved $3M in cloud costs and how you can save some too.
Hi and welcome to the Elanco Azure Cost Optimisation Dashboard!
Throughout the last quarter, the SolutionOps and TechOps Teams have been busy identifying cost saving opportunities in the Azure cloud environment. By making simple changes across the board, like the introduction of Reserved Instances for Virtual Machines and working with App Owners to implement some of our architectural recommendations, we have been able to make dramatic savings. Together, we have already reduced Elanco’s annual Azure bill by almost $3M! As part of the project we created a PowerBI based Dashboard to help visualise cloud spend and share our recommendations, giving you the tools to continue to monitor and fine tune.
We’re delighted to share it here: Azure Cost Optimisation Dashboard
The Dashboard is designed to give ITLT, Business Unit Advisors and App Teams visibility into the cost of the Azure resources supporting Elanco’s portfolio of applications. You can use the app to monitor costs, usage trends, and identify cost optimisation opportunities to reduce your expenditure.
This is achieved by presenting several views of cost data through Executive Leadership, Business Unit and Application Specific dashboards. There is also a dashboard to present various cost optimising recommendations for your applications.
The resulting benefit to the business is that Elanco becomes a more ‘cost-conscious’ organisation with leadership and application owners not only having visibility into the cost of their Azure resources, but instructions for scaling down over-provisioned or under-utilised resources, removing resources that are no longer required and solid recommendations for updating the architecture where it makes sense for the business.
Please note:
- The data is not realtime; it is updated daily at 11:30 GMT.
- It is not currently able to show savings resulting from the Reserved Instances or the cost of distinct resources (such as Azure Data Factories) across multiple applications but we are looking to implement those features in the future.
- The forecast calculations for upcoming months will be refined in the coming week.
- The costs of Elanco Lab Azure resources are not reflected in the dashboard as they are not part of the dataset.
- Elanco Lab Azure resources are not reflected in the dashboard as they are out of the scope of the dashboard.
We will continue our work to identify opportunities for improvement across our IT landscape.
Quick Tips
Export Data to Excel
Export data from the Dashboard charts by using the buttons at the top left corner of the main chart.
- Hover over the chart, click the three dots that appear in the top right and select ‘Export data’ from the drop-down menu.
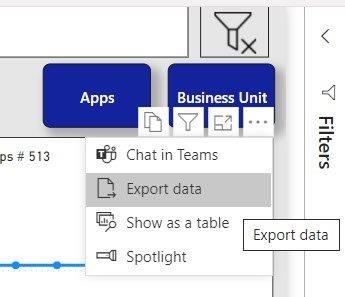
- In the resulting dialogue, click the Export button and your browser will download the file.
Save a Personal View
Create a personal view of the dashboard to save the filters you have applied to show only your Business Unit or your Applications etc.
- Select your preferred filters to customise the view.
- Click the Bookmarks icon on the right of the menu bar and select ‘Add a personal bookmark’
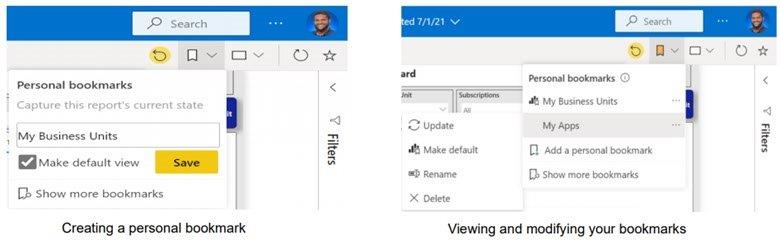
- Name the bookmark, (optionally) tick the box ‘Make default view’ and click ‘Save’.
- To clear a Bookmark or Default view, go to bookmarks and click on the three dots next to the name of the bookmark. From the menu, select ‘Clear default’ or ‘Delete’.